In the realm of data, the journey from raw numbers to informed decisions is marked by the twin pillars of data analysis and data visualization.
My dedication lies in the art of deciphering data’s intricate stories through rigorous analysis and translating those insights into compelling visual narratives.
The Art of Data Analysis:
Data analysis involves employing many techniques to unravel the secrets hidden within data.
My expertise in this area encompasses a wide range of methods:
I employ statistical techniques to discern patterns, trends, and correlations within datasets, enabling data-driven decision-making.
I harness the power of machine learning algorithms to build predictive models, classify data, and uncover complex relationships.
Data Interpretation:
I translate data into meaningful insights, distilling actionable information and generating narratives that drive strategies.
Hypothesis Testing:
I apply hypothesis testing and experimentation to validate assumptions and guide critical decisions.
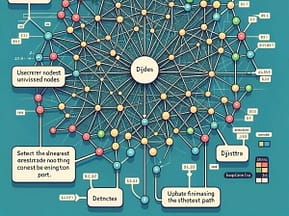
The Art of Data Visualization:
Data visualization, on the other hand, transforms raw data into a visually engaging story that is accessible and understandable.
My approach to data visualization includes:
Information Design:
I create visually compelling designs, focusing on the aesthetics and layout of data visualizations to ensure that information is easy to interpret.
Charting and Graphs:
I employ a variety of chart types, graphs, and interactive elements to present data most appropriately and engagingly.
Interactive Dashboards:
I develop interactive dashboards that empower users to explore data, uncover insights, and make data-driven decisions.
Color Psychology:
I utilize color to evoke emotions, direct attention, and enhance the user’s understanding of the data.
Revealing Insights, Shaping Decisions:
I’ve had the privilege of applying my data analysis and data visualization skills to a wide array of projects, such as:
Financial Data Analysis:
For financial institutions, I’ve conducted in-depth data analysis to track market trends, assess risk, and make investment decisions.
Public Health Data Visualization:
In public health, I’ve designed data visualizations to monitor disease outbreaks, vaccination coverage, and healthcare resource allocation.
I’ve used data analysis and visualization to help businesses optimize marketing strategies, understand customer behavior, and enhance user experiences.
Educational Analytics:
I’ve empowered educational institutions with data-driven insights into student performance, learning trends, and resource allocation.
Data analysis and visualization are not just tools; they are mediums through which data is transformed into knowledge.
I am passionate about the intersection of analytics and art, where data speaks a universal language that empowers smarter decision-making.